
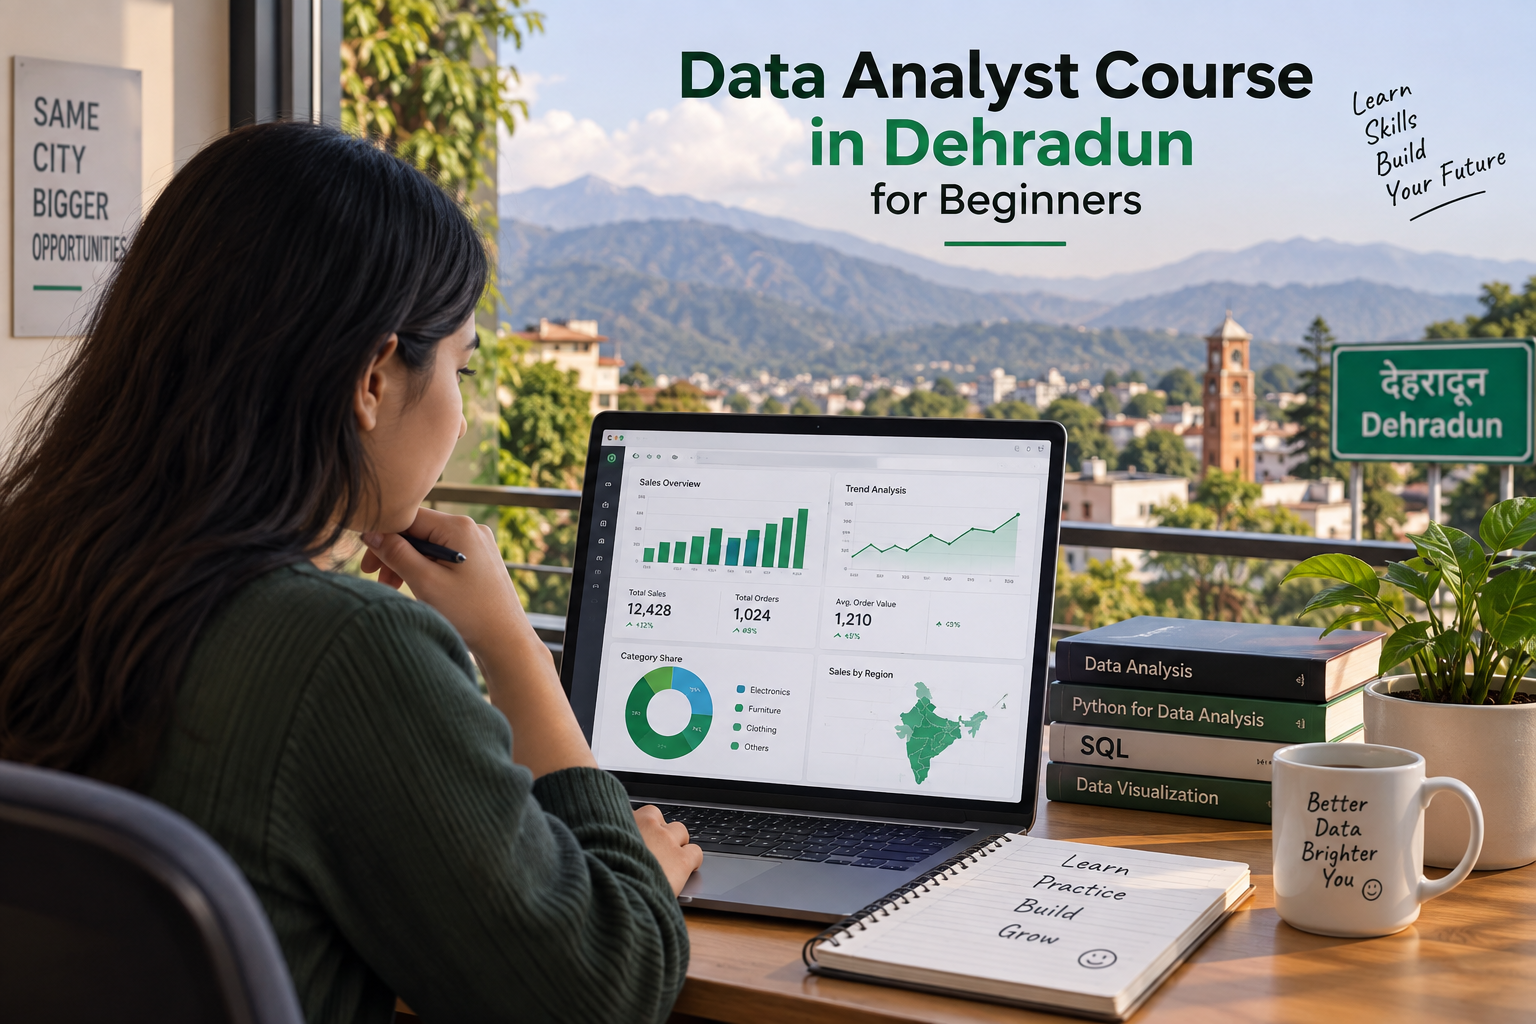
Yes. Beginners and non-technical students can become data analysts by learning business fundamentals, analytical judgement, AI fluency, Excel, SQL, Power BI, and Python in a sensible order. You do not need advanced mathematics or a software engineering background. You need curiosity, logical thinking, consistent practice, and the ability to explain what the data means for a real decision.
A good data analyst course in Dehradun should take you from beginner concepts to portfolio-ready work: cleaning messy data, defining KPIs, querying databases, building dashboards, using AI responsibly, and communicating recommendations to stakeholders.
Key takeaways
- No prior coding experience is needed to start, though SQL quickly becomes essential and Python adds value later.
- Learn in this order: business thinking, statistical judgement, AI fluency, then Excel, SQL, Python, Power BI, and automation. Tools last, not first.
- A portfolio of realistic projects does more for employability than a certificate.
- Non-technical learners can enter through data analyst, reporting, MIS, business analyst, operations, or BI roles.
- Titled analyst roles in Dehradun are limited, so plan to apply for remote and hybrid roles too.
- OneLeap’s Strategic Data Analyst with AI is built for beginners and career switchers: six months, weekend classes, seven modules, and seven projects.
Table of contents
- What does a data analyst actually do?
- Is data analytics suitable for non-technical students?
- A business-first roadmap for beginners
- Data analyst skills for beginners
- Projects that build a job-ready portfolio
- Career roles after a data analytics course
- Data analyst salary in India by skill level
- Data analyst jobs in Dehradun and remotely
- How to choose the best data analyst course in Dehradun
- OneLeap Strategic Data Analyst with AI
- Common mistakes beginners should avoid
- Frequently asked questions
- Final thoughts
What does a data analyst actually do?
A data analyst collects, cleans, queries, analyses, and visualises data so an organisation can make better decisions. Typical work includes tracking KPIs, studying sales trends and customer behaviour, measuring marketing campaigns, monitoring operations, forecasting demand, and preparing reports for stakeholders.
The role is not really about making charts. A good analyst answers four questions: what happened, why it happened, what might happen next, and what the organisation should do about it. That last question is why business understanding and communication matter as much as tools.
Is data analytics suitable for non-technical students?
Analytics is a practical technology career for students from commerce, management, humanities, science, engineering, BCA, BBA, or any other background. You can begin with business questions and spreadsheets, then build technical depth step by step. Here are the five concerns beginners raise most often.
| Concern | Reality |
|---|---|
| “I cannot code.” | You can begin with Excel and SQL. Python comes later, once your analytical foundation is solid. |
| “I am not good at advanced maths.” | Entry-level analytics needs practical statistics and logical reasoning far more than calculus. |
| “I do not have a technical degree.” | Employers look for evidence of skills, projects, communication, and problem-solving rather than a degree title. |
| “AI will replace analysts.” | AI automates repetitive work, but analysts who frame problems, validate outputs, and guide decisions remain valuable. Being able to check AI output is now part of the job. |
| “I need to learn every tool first.” | Learn one coherent workflow and build projects with it. Depth and application beat a long tool list. |
A business-first roadmap for beginners
Most beginners fail by starting with tools. They open a Python tutorial, then a SQL course, then a Power BI video, and end up with fragments instead of the ability to answer a business question. A business-first sequence works better: understand the decision, learn to judge evidence, then pick up the tools that serve both.
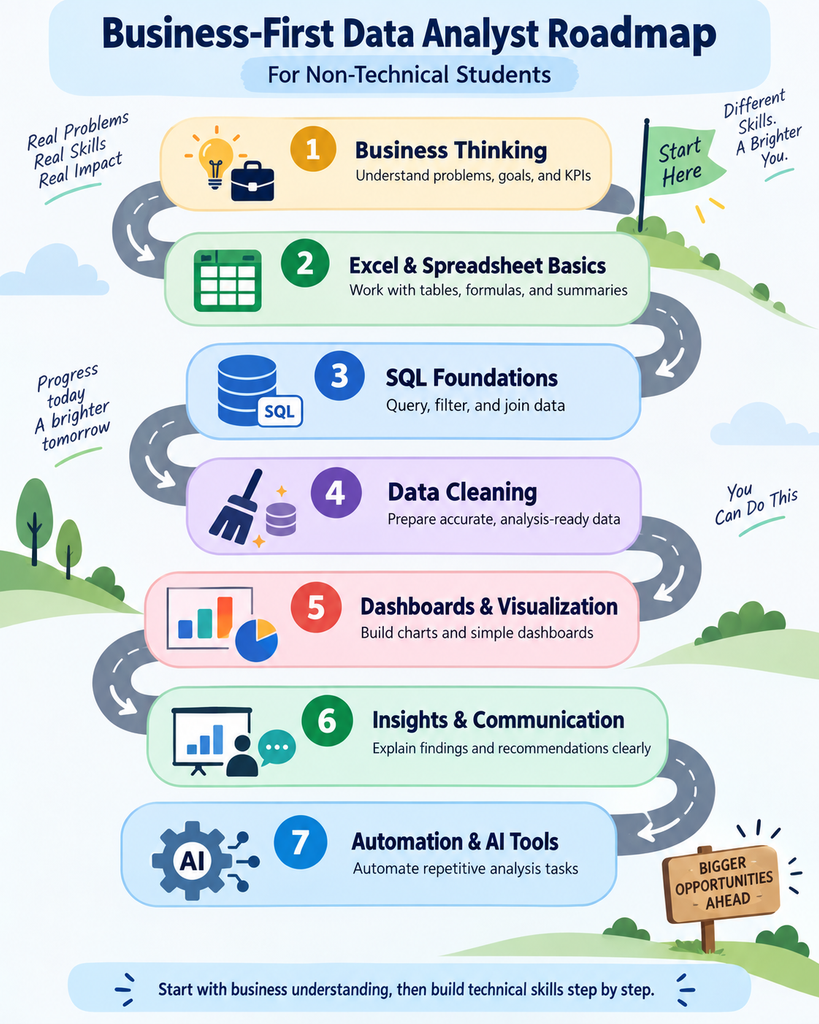
The seven phases below follow that logic. Timings assume roughly 15–20 hours a week including practice, which adds up to a little over six months in total. Adjust them to your own pace.
Phase 1: Strategic mindset and business acumen
Learn how organisations create value, which decisions managers actually make, and how to tell a business problem from an analytical one. Practise defining KPIs and success metrics for a company you know.
- Why it sits here: an analyst who can frame the right question is more useful than one who can only run queries. Starting here also means every tool you learn later has something real to be pointed at.
- Time: Roughly 2–3 weeks
Phase 2: Statistical thinking and analytical judgement
Cover correlation versus causation, variability and noise, statistical significance and confidence, and the traps: sampling bias, survivorship bias, and data leakage. Learn to judge whether a pattern is real.
- Why it sits here: judgement protects you from confidently presenting a wrong answer, and it is the skill you will use to check AI-generated output in the next phase.
- Time: Roughly 2–3 weeks
Phase 3: AI fluency and prompt engineering
Learn what generative AI and LLMs can and cannot do, how to write effective prompts, how to ask for structured output such as tables and summaries, and what responsible use means for business data.
- Why it sits here: AI assistants can draft SQL, explain formulas, and summarise findings, so learning to use and check them early makes every later phase faster. You still validate every calculation yourself.
- Time: Roughly 2–3 weeks
Phase 4: AI-powered data analysis with Excel, SQL, and Python
Excel for cleaning, pivot tables, and dashboards. SQL for database concepts, queries, joins, and window functions. Python for Pandas, NumPy, and exploratory analysis. Learn them as one workflow rather than three separate courses.
- Why it sits here: these are the daily working tools of an analyst. Do not skip SQL because Excel feels easier; SQL is the skill most entry-level job descriptions insist on.
- Time: Roughly 6–8 weeks, the longest phase
Phase 5: Visual intelligence and data storytelling
Learn data modelling fundamentals, the difference between executive and operational dashboards, how to choose the right visual, and how to build reports with filters and drill-downs in Power BI.
- Why it sits here: a dashboard is how most of your work reaches decision-makers. Build it only once you know what question it answers.
- Time: Roughly 3–4 weeks
Phase 6: AI knowledge systems and RAG basics
Understand retrieval-augmented generation, how to connect an AI assistant to approved documents and databases, and how to build a simple assistant that answers questions with sources.
- Why it sits here: this is the newest skill on the list and the one fewest fresher candidates have. Even a basic working example makes a beginner portfolio stand out.
- Time: Roughly 2–3 weeks
Phase 7: Predictive analytics and intelligent automation
Learn forecasting and trend analysis, no-code AutoML, KPI monitoring, anomaly detection, and workflow automation, then combine them into one end-to-end piece of work.
- Why it sits here: prediction and automation only make sense once you can define a KPI, judge a result, query the data, and present it. This phase is what moves you beyond static reporting.
- Time: Roughly 4–5 weeks
If you prefer a guided version of this sequence, it is the same order used by OneLeap’s seven programme modules, described below.
Data analyst skills for beginners
| Skill area | Beginner focus | Why employers value it |
|---|---|---|
| Business acumen | KPIs, stakeholders, business questions, recommendations | Connects analysis to decisions and outcomes |
| Statistics and judgement | Bias, variability, correlation, confidence, evaluating AI output | Prevents confident but misleading conclusions |
| AI fluency | Prompts, AI-assisted analysis, validation, responsible use | Increases speed while keeping the analyst accountable |
| Excel or Sheets | Cleaning, formulas, pivots, lookups, dashboards | Still the default tool on business and operations teams |
| SQL | Queries, joins, aggregations, CTEs, window functions | The most common screening skill for analyst roles |
| Python | Pandas, NumPy, exploratory analysis, automation | Supports repeatable analysis and larger datasets |
| Power BI or Tableau | Data models, measures, filters, dashboards, storytelling | Makes insights usable by decision-makers |
| Communication | Presentations, documentation, plain-language recommendations | Helps stakeholders understand what to do next |
Projects that build a job-ready portfolio
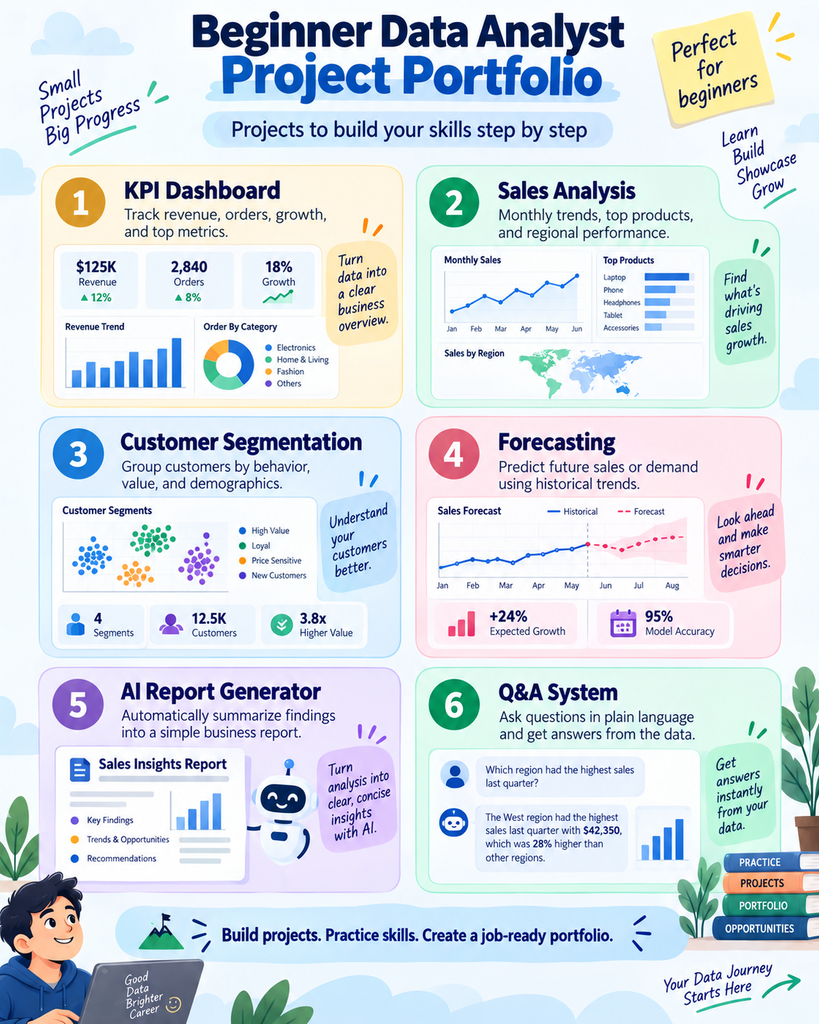
A portfolio should show how you solve a business problem, not that you finished a tutorial. These six projects cover the range an entry-level employer looks for, and each can be built with public data before you enrol anywhere.
| Project | What you build | Skills demonstrated |
|---|---|---|
| Business KPI dashboard | An executive dashboard covering revenue, conversion, and retention, with filters, drill-downs, and a written recommendation | Excel or Power BI, data modelling, KPIs, storytelling |
| Sales performance analysis | A SQL and Python analysis of trends, seasonality, regional performance, and growth opportunities | SQL, Python, exploratory analysis, business interpretation |
| Customer segmentation | Segments based on behaviour or demographics, each tied to a specific recommended action | Python, clustering basics, visualisation, marketing thinking |
| AI-powered report generator | An automated workflow that calculates KPIs, drafts a summary, flags anomalies, and sends a report for review | Prompting, validation, automation, reporting |
| Revenue or demand forecast | A forecast monitored against actuals, compared with a simple baseline such as last year’s figures | Time-series thinking, forecasting, KPI monitoring |
| Company-data Q&A system | A retrieval-based assistant that answers questions from approved documents and cites its sources | RAG basics, data connection, source-aware answers, responsible AI |
Choose a domain you want to work in, such as retail, finance, SaaS, marketing, operations, education, healthcare services, or HR, and shape your project questions around it. Domain relevance makes a beginner portfolio far more credible than a generic exercise.
For more project ideas with public datasets and evaluation tips, see AI Portfolio Projects for 2026.
Career roles after a data analytics course
| Entry role | Typical work | Skills to emphasise |
|---|---|---|
| Data Analyst | Analysis, dashboards, reports, insights | SQL, Excel, Power BI, Python, statistics |
| Reporting or MIS Analyst | Recurring reports, data accuracy, KPI tracking | Excel, SQL, dashboards, attention to detail |
| Business Analyst | Requirements, decision support, process analysis | Business acumen, documentation, SQL, communication |
| Operations Analyst | Performance monitoring, process improvement, forecasting | SQL, Power BI, process thinking, automation |
| Marketing Analyst | Campaign, funnel, ROI, and customer analysis | SQL, dashboards, statistics, storytelling |
| BI Developer | Data models, dashboards, enterprise reporting | SQL, Power BI or Tableau, data modelling |
Data analyst salary in India by skill level
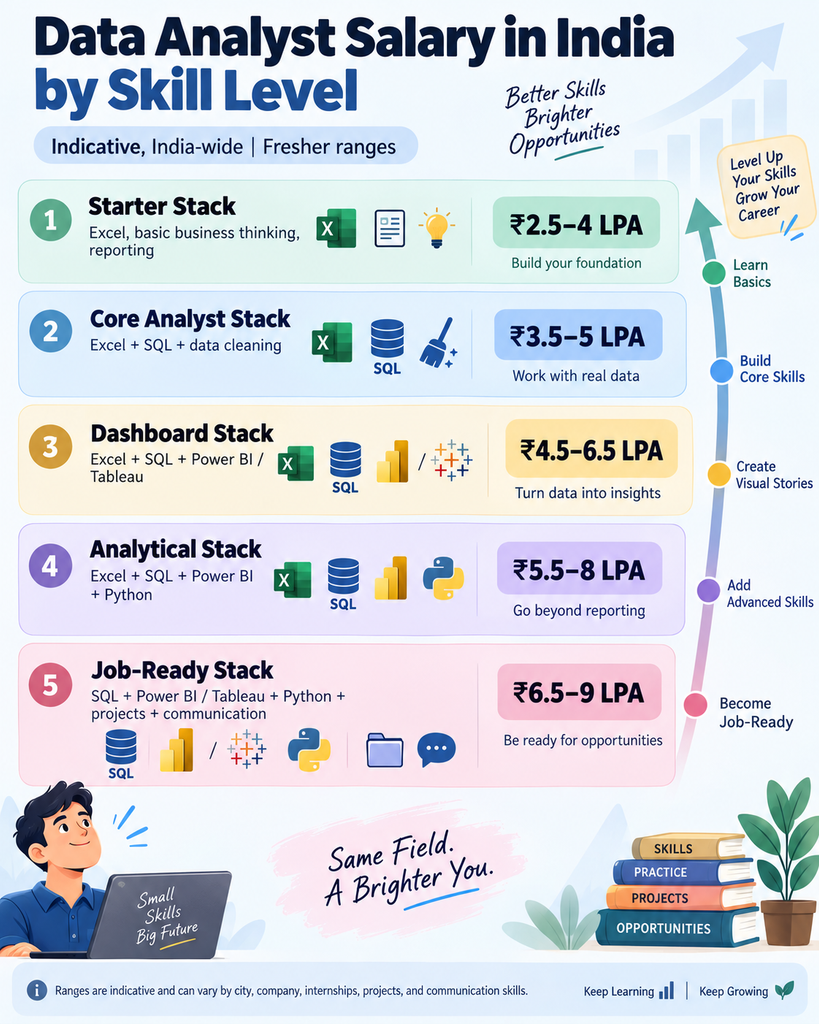
Pay depends on skills, portfolio quality, internships, communication, employer, location, and interview performance. The ranges below are indicative India-wide fresher figures based on commonly reported 2026 data from salary aggregators such as Glassdoor, AmbitionBox, and Indeed. They are market ranges, not guaranteed outcomes of any course.
| Demonstrable skill stack | Likely entry direction | Indicative fresher range |
|---|---|---|
| Excel + basic reporting | MIS Executive, Reporting Analyst, junior operations support | ₹3–4 LPA |
| Excel + SQL + Power BI | Data Analyst, BI Analyst, Business Analyst | ₹3.5–5.5 LPA |
| SQL + Power BI + Python + statistics | Data Analyst, Product Analyst, Analytics Associate | ₹4.5–7 LPA |
| The above + forecasting, AI workflows, automation | Analytics Associate, Operations Analyst, AI-assisted analyst | ₹5–8 LPA in stronger roles |
Two caveats worth knowing before you plan around these numbers. Employers based in Dehradun often pay below the national figures for entry-level roles, while remote roles with national companies follow the employer’s own pay bands. Skills move these numbers more than job titles do: SQL plus a BI tool is the combination that most reliably lifts an entry-level offer.
Data analyst jobs in Dehradun and remotely
Search beyond the exact title “Data Analyst”. In Dehradun, entry opportunities more often appear as Data Analyst Intern, Reporting Analyst, MIS Executive, Business Analyst, Operations Analyst, Data Associate, or Analytics Intern.
Be realistic about scale. Dehradun’s job market is growing, but a large share of local postings, including many around the IT Park on Sahastradhara Road, are in customer support, operations, digital marketing, and general IT services. Titled analyst roles exist but are limited, so combine local applications with remote and hybrid roles across India and nearby hubs such as Delhi NCR and Chandigarh.
- Local targets: IT services companies, startups, digital businesses, education organisations, tourism and hospitality, healthcare services, and operations teams.
- Remote targets: e-commerce, SaaS, consulting, finance, research, marketing analytics, and data operations teams.
- Where to search: LinkedIn, Indeed, Naukri, company career pages, internship platforms, local alumni networks, and analytics communities.
- What gives you an edge: public dashboards, a GitHub repository, SQL case studies, short demo videos, and a clear business recommendation in every project.
If you are still deciding between analytics and AI engineering, see AI Course vs Data Analytics Course in Dehradun.
How to choose the best data analyst course in Dehradun
- A beginner-friendly entry point. No unnecessary coding barrier, and a clear progression from business concepts to SQL, BI, Python, and AI.
- The complete skill stack. Excel, SQL, Python, Power BI or Tableau, statistics, communication, and business acumen in one path.
- Real projects with feedback. Messy datasets, real business questions, domain relevance, and someone reviewing your work.
- Live mentorship. Classes you can ask questions in, office hours, and project reviews rather than recordings alone.
- Portfolio support. Help with documentation, dashboards, GitHub, resume bullets, and explaining projects in interviews.
- Practical details in writing. Batch format, schedule, total fees including taxes, and the refund policy.
- Caution on guarantees. Treat “100% placement” or guaranteed-salary claims carefully, and ask what career support actually involves.
- Responsible AI. Validation, privacy, bias, limitations, and human review, not blind dependence on AI tools.
OneLeap Strategic Data Analyst with AI
OneLeap’s Strategic Data Analyst with AI programme follows the same business-first sequence described above. It is aimed at aspiring analysts, business professionals who use data for decisions, Excel users moving into SQL, Python, and Power BI, and career switchers.
| Programme detail | What the brochure states |
|---|---|
| Duration | 6 months, with 70+ hours of live learning |
| Schedule | Weekend classes, Saturdays and Sundays |
| Format | Live interactive sessions plus hands-on labs |
| Structure | 7 modules and 7 real-world projects, including an end-to-end capstone |
| Mentorship | Weekly 30-minute one-to-one open office sessions |
| Entry requirements | No coding experience required; a logical bent of mind and commitment to learning. Basic Excel familiarity helps but is not required. Admission includes a qualification interview. |
| Expected commitment | 6 Months |
| Certification | Merit-based only |
| Fees and batch dates | Check Website |
| Location | GMS Road, Dehradun |
The seven modules run from strategic mindset and business acumen, through statistical thinking, AI fluency and prompt engineering, AI-powered analysis in Excel, SQL, and Python, visual intelligence and data storytelling in Power BI, AI knowledge systems and RAG, to predictive analytics and intelligent automation.
The seven projects are a business KPI dashboard, a sales performance analysis, a customer segmentation model, an AI-powered report generator, a Q&A system on company data, predictive revenue forecasting, and an end-to-end analytics capstone. Each can be adapted to the domain you want to work in, so your portfolio reflects relevant experience rather than generic exercises.
Teaching is led by practitioners: founder Shubham Pandey, previously at American Express, with a chief AI architect previously at Cargill Foods, a senior faculty member who is a director at Morgan Stanley, and a curriculum advisor who formerly headed AI at L&T Finance. Career support covers resume and LinkedIn positioning, mock interviews, portfolio coaching, and introductions to hiring companies.
Explore the curriculum and programme details: OneLeap Strategic Data Analyst with AI.
Common mistakes beginners should avoid
- Starting with tools instead of business questions, then collecting half-finished tutorials.
- Skipping SQL because Excel feels easier.
- Building dashboards with no business question and no recommendation.
- Copying projects without understanding the data, the logic, or the limitations.
- Trusting AI-generated SQL or insights without checking the numbers yourself.
- Presenting technical output without explaining what it means for the business.
- Waiting until the end of a course to start building a portfolio.
- Applying only to “Data Analyst” titles and missing reporting, MIS, operations, BI, and business analyst roles.
Frequently asked questions
Can a non-technical student become a data analyst?
Yes. Start with business concepts and analytical judgement, then add AI fluency, Excel, SQL, Power BI, Python, and automation in that order. Consistent practice and real projects matter more than starting with a technical degree.
Is coding required for a data analyst course in Dehradun?
Not to begin. SQL is essential for most analyst roles and Python becomes valuable for repeatable analysis and automation, but a beginner-friendly course teaches both progressively. OneLeap’s programme states that no coding experience is required, and that basic Excel familiarity is helpful but not mandatory.
What are the most important data analyst skills for beginners?
Business understanding, SQL, a BI tool such as Power BI, practical statistics, and clear communication. Python and AI-assisted analysis add value once those are solid. Employers usually screen on SQL and dashboards first.
How long does it take to become a data analyst?
Most structured programmes run about four to six months. Realistically, job readiness depends on project quality, interview preparation, and how consistently you apply, so allow extra time after the course for your search.
What is the best data analyst course for beginners?
One with a clear learning order, the full stack of Excel, SQL, Power BI, Python, statistics, and AI workflows, real projects with feedback, live mentorship, portfolio support, and interview preparation. Ask to see student projects before enrolling.
What salary can a fresher data analyst expect in India?
Indicative ranges are roughly ₹3–4 LPA for Excel and reporting skills, ₹3.5–5.5 LPA with SQL and Power BI, and ₹4.5–7 LPA with Python and statistics added. Dehradun-based employers often pay below these national figures. These are market ranges, not guaranteed outcomes.
Can I get a data analyst job in Dehradun?
Yes, though titled analyst roles are limited locally. Look for internships and for MIS, reporting, operations, and business analyst positions, and apply to remote and hybrid roles across India at the same time. A visible portfolio helps you compete beyond your location.
Do I need a technical degree to enrol?
No. Programmes aimed at career switchers usually ask for a logical bent of mind and commitment rather than a specific degree. OneLeap also runs a short qualification interview before admission.
Final thoughts
A data analyst course in Dehradun can be a practical starting point for beginners and non-technical students who want to move into technology and business analytics. Learn in the right order, practise on real data, build domain-relevant projects, and get comfortable explaining insights in business language.
If you want a structured, business-first path with live weekend classes, seven real projects, AI-powered analytics, and career support, explore OneLeap’s Strategic Data Analyst with AI programme.

Leave a Reply