
Introduction
Data analysts need to know SQL. This is because it is the way to get to the data that is stored in databases. With SQL you can do lots of things with the data. You can clean it up combine it with data and summarize it. It is the basis for doing analysis in companies. It does not matter if you use tools, like reporting or visualization tools. SQL is still very important. It works well with these other tools. Data analysts use SQL to get the data they need. Then they can use other tools to help them understand the data. SQL is not replaced by these tools it is used with them.
Think of SQL as the language businesses use to talk to their data. Every dashboard, every report, and every KPI you see started as a SQL query somewhere.
Key Takeaways
• When people start working with data SQL is usually the thing they learn to get useful information from a big pile of data.
• You need to know SQL to look at the data that is stored in a kind of database.
• SQL helps you work with data faster and make mistakes than if you were just using spreadsheets.
• If you want to use tools like Power BI and Tableau to make pictures with your data you need to make sure your data is ready first and SQL is a big part of that.
• Companies that do analytics and business intelligence really want people who know SQL.
• If you are just starting out learning SQL is a way to get into a career working with data.
• Oneleap Dehradun offers training, in SQL, analytics. Using artificial intelligence to work with data that will actually help you get a job.
What SQL Means for Data Analysts?
SQL stands for Structured Query Language. It is the language, for working with relational databases.
Data analysts use it to get the data they need. They combine data from tables and summarize results. This helps with reporting and decision-making.
SQL helps turn database records into answers to business questions.
Why SQL Matters
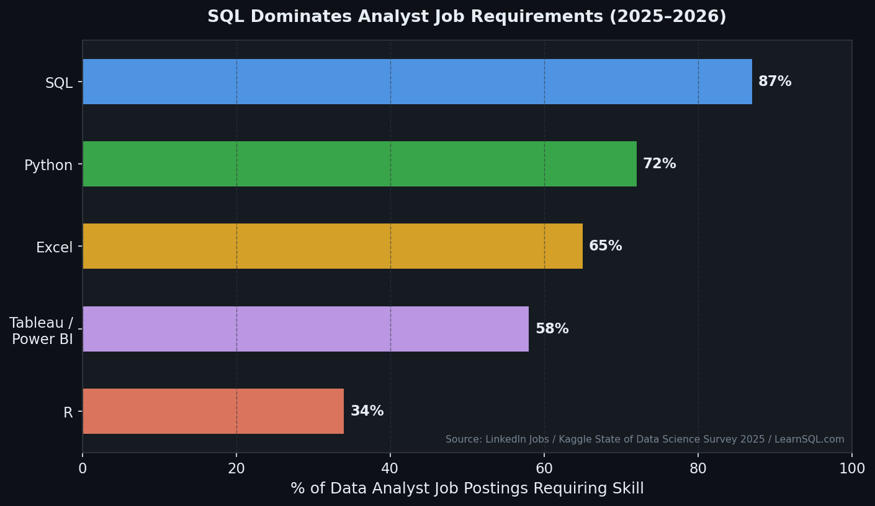
SQL is really important because most of the data that companies have is stored in databases not in charts or spreadsheets. If people who analyze data know SQL they can get the data they need right from the database of having to wait for someone else to get it for them. This saves a lot of time makes the data more accurate and makes the analysts more able to work on their own every day.
It also helps teams work faster because the same work can be used again and again for reports that have to be done over and over, dashboards and tracking numbers.
SQL is also important because it helps people think clearly when they are analyzing data. When analysts learn how to work with data like filtering, joining, grouping and aggregating they learn how to break down business problems into steps.
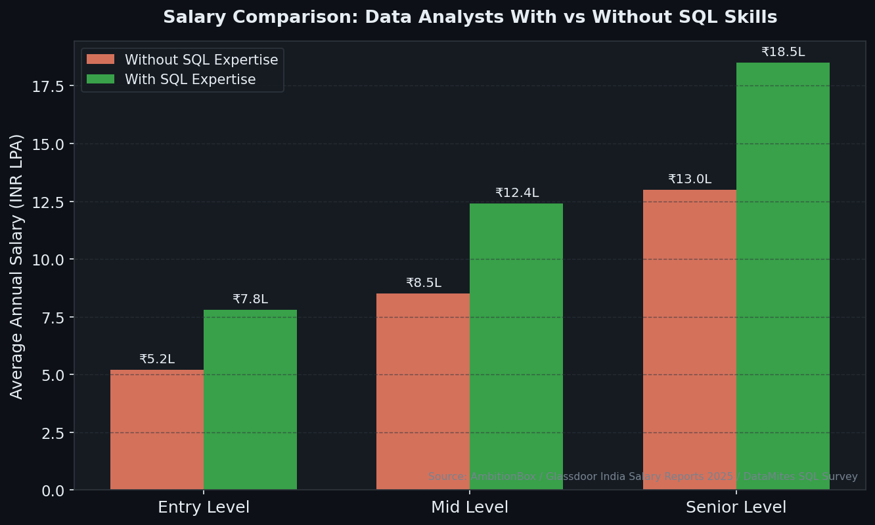
This is why SQL is a skill for people who want to be data analysts work with business information or make reports. For people looking for jobs knowing SQL is often what makes them ready to start working, than just being a beginner and that is why it matters.
How SQL Works
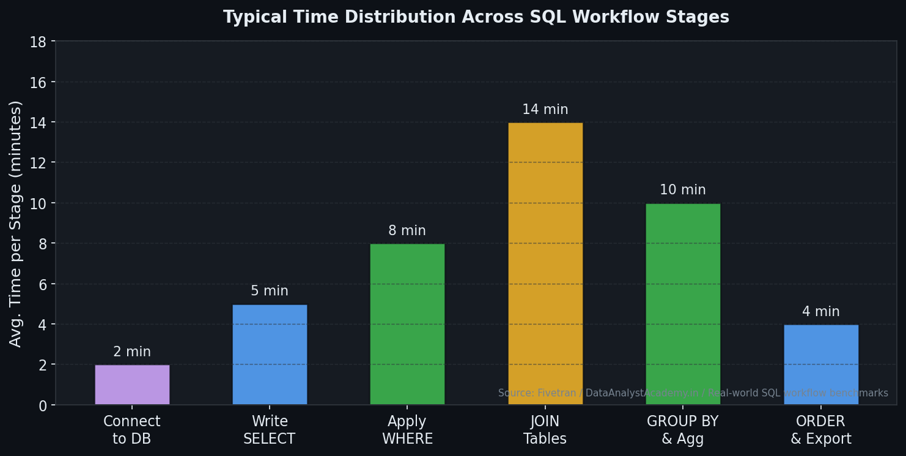
The way SQL works is really helpful for analytics projects. This is because SQL gets the raw data ready for the tools that people use to look at reports and pictures of the data. Here is how it works:
1. SQL gets connected to a database that has all the business information.
2. The person who does the analysis writes a request to say what data they need.
3. The WHERE part makes sure that only the important information is included.
4. The JOIN part puts together tables that have related information, like customer information orders and payments.
5. The GROUP aggregate functions parts summarize the data into simple numbers like total sales, average order value or how many customers there are.
6. The ORDER BY part sorts the information so it is easy to see what is going on.
7. The final result is then used to make dashboards, reports, spreadsheets or to do more analysis, on the SQL data.
Core Components of SQL
| SQL Clause / Function | Purpose | When Analysts Use It |
| SELECT | Chooses columns for analysis | Every query — the starting point |
| FROM | Identifies the source table | Every query |
| WHERE | Filters rows before grouping | Removing irrelevant records early |
| JOIN | Merges related tables together | Combining customers, orders, payments |
| GROUP BY | Aggregates data by category or segment | Metrics like total sales, avg order value |
| HAVING | Filters grouped results after aggregation | Segment-level filtering (e.g. revenue > 10k) |
| Aggregate Functions | COUNT, SUM, AVG, MIN, MAX | Measuring performance across rows |
| ORDER BY | Sorts the output for readability | Trend identification and ranked lists |
Tools and Technologies
| Category | Tools / Technologies | Why They Matter |
| Databases | MySQL, PostgreSQL, SQL Server, Oracle | Common systems where analysts query business data. |
| BI Tools | Power BI, Tableau | Turn SQL-prepared data into dashboards and reports. |
| Spreadsheet Tools | Excel, Google Sheets | Quick summaries, lightweight charts, and collaboration. |
| Analytics Support | Python, pandas | Advanced cleaning, automation, and deeper analysis after SQL. |
| Visualization Platforms | Looker Studio, Metabase, Redash, Zoho Analytics | Help analysts present insights clearly to business users. |
Real World Examples
1. SaaS Churn Analysis
* The problem was that a SaaS company needed to figure out which customers were going to cancel their subscriptions.
* To solve this problem the analyst used SQL to put information about when customers logged in how they used the product and the support tickets they submitted in order to find customers who were not using the product very much.
* The result of this analysis was that the company was able to identify customers who were, at risk of canceling their subscriptions and flag them for follow up.
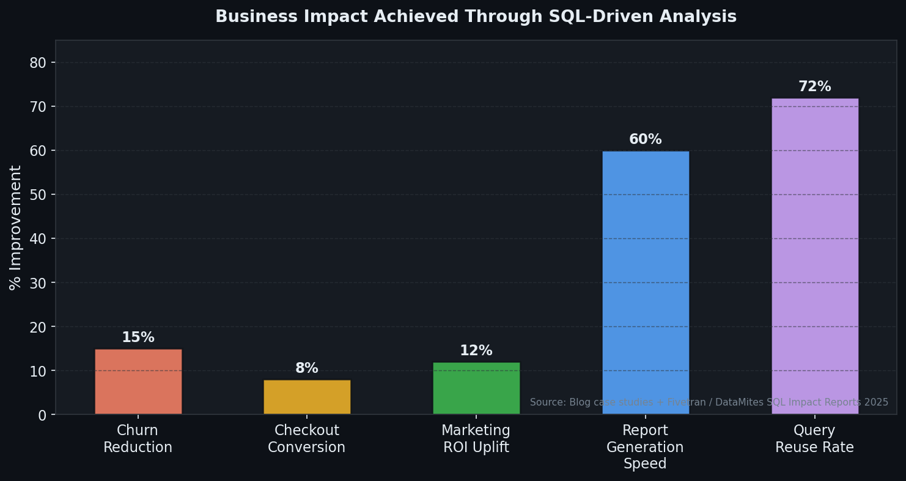
* The impact of this was that the SaaS company was able to reduce the number of customers who canceled their subscriptions by 15 percent by taking steps to keep these customers.
2. E-commerce Checkout Drop-off
* The problem was that lots of people were adding things to their shopping carts online but not actually buying them.
*The solution was to use SQL to see where people were getting stuck in the buying process.
* The result was that the online store found out that people were having trouble with the checkout part.
*The impact was that making the checkout easier led, to 8% more people actually completing their purchases.
3. Marketing ROI Analysis
*The retail brand had a problem. They did not know which campaigns actually drove revenue for the brand.
*To solve this problem the analyst used SQL to look at purchases and see where people were coming from and then the analyst compared how each campaign for the retail brand was doing.
*The result was that the retail brand found out which channels were really working well such as email campaigns for the brand and social media campaigns for the retail brand.
*This had an impact on the retail brand because the retail brand was able to move its budget around and improve the return on investment, for the retail brand by 12 percent.
Best Practices
• Start learning SQL joins early because real-world analysis depends on combining tables correctly.
• Use table aliases to keep queries short and readable.
• Avoid using SELECT *. Instead pull only the columns you actually need.
• Try to filter data as early as possible to improve clarity and performance.
• After joins , always validate row counts to catch duplication or missing records.
• Handle values carefully especially in filters and calculations.
• Format SQL consistently so it is easier to review and debug.
• When working with datasets or slow queries , check execution plans.
• Compare query output with business expectations before sharing with stakeholders.
• Build query logic for recurring reports and KPI dashboards.
• Practice with datasets instead of only syntax exercises.
For learners a structured course is a next step. Oneleap‘s Strategic Data Analyst with AI course offers guided SQL practice and job-ready analytics skills. The course provides a learning path.
Common Mistakes
| Mistake | Why It Happens | What to Do Instead |
| Using SELECT * | Feels fast and convenient | Select only the fields you actually need. |
| Confusing WHERE and HAVING | Beginners mix row-level and group-level filtering | Use WHERE before grouping, HAVING after. |
| Wrong join conditions | A small key mismatch creates bad results | Double-check join keys and validate row counts. |
| Ignoring NULL values | NULL is misunderstood as empty or zero | Use IS NULL and IS NOT NULL correctly. |
| Missing GROUP BY fields | Analysts focus on metrics, forget grouping rules | Group every non-aggregated column properly. |
| Trusting output without checks | The query runs so it looks correct | Sanity-check outputs against business logic. |
Frequently Asked Questions
Q1. Is SQL still important if I know Power BI or Tableau?
Yes. SQL is important because it helps get the data ready for Power BI or Tableau to make dashboards and reports.If the data is not good then even the best tool, for making pictures of the data cannot give us information.
Q2 Can I become a data analyst without knowing SQL?
You can start doing data analysis without SQL. You will not have as many job options and you will not be able to work on your own as much.Most people who do data analysis need to know SQL. If you do not know it it is hard to work with the raw data from businesses.
Q3. Is SQL hard to learn?
No. SQL is really easy to learn. The basic words and sentences used in it are simple to understand . Most people who work with data can start using SQL to get the information they need within a weeks of practicing.
Q4. What should you learn after SQL?
A lot of people learn Excel, Power BI, Tableau or Python after they know SQL. This is because they want to do things with their skills.. No matter what they choose SQL is always useful. SQL works with all of these tools.
Q5. Why do employers still ask for SQL often?
This is because SQL is an important skill for getting, cleaning and summarizing business data. Most companies use something called a database to store their data. SQL is necessary, for working with this kind of database. So companies really like it when people can use SQL on their own.
Final Summary
SQL is really important for a data analyst. This is because it is at the center of how we do analytics work.It helps data analysts get the information get it ready to use and help companies make good decisions with solid information. We also use tools like visualization tools, Python and spreadsheets but SQL is the base that makes these tools really useful. It is what makes all these other tools work better. We need SQL to get the most out of visualization tools, Python and spreadsheets. Data analysts use SQL every day to do their job. It is still the important skill, for a data analyst.
Stay updated with the latest AI, Data Science, and Automation insights by following OneLeap on LinkedIn and Instagram.
Sources Links
• Data Analyst Academy: Why SQL Is the Most Important Skill for Data Analysts in 2026
• Fivetran: Why SQL is a must-have skill for every data analyst
• Northeastern University: 5 Reasons SQL Is The Need-to-Know Skill For Data Analysts
• LearnSQL: Why Should Every Data Analyst Know SQL?
• NareshIT: Introduction to SQL for Data Analytics
• Coursera: The Best Data Visualization Tools for Businesses
• ThoughtSpot: Best Data Visualization Tools in 2026
• DataMites: SQL vs Python for Data Analytics in 2026
• Medium: Why SQL Is Essential for Every Data Analyst’s Career

Leave a Reply