Introduction
Data Analytics is the procedure of examining raw data to unlock different patterns, dig out meaningful insights and improve decision making.
To become a Data Analyst in India, one should have skills in SQL, Python/R, Excel and data visualization tools like Tableau and Power BI, along with certifications and real-world projects.
In terms of earnings, a Data Analyst in India earns around ₹3.5 LPA (fresher) to ₹30 LPA (senior/lead), with the national average at ₹6.87 LPA.
Key Takeaways
- Definition: Process of collecting, analysing and processing raw datasets to find patterns and trends.
- Present (2026): India’s data analytics industry is worth $118.7 billion with 500,000+ open jobs and an 11-lakh talent shortage.
- Salary Range: ₹3.5–6 LPA (fresher) → ₹8–14 LPA (mid-level) → ₹14–30+ LPA (senior).
- Skills Required: SQL, Python/R, Excel, Tableau/Power BI, Statistics, ML basics, AI/ML governance.
- Future Outlook: 40% growth in AI analytics roles; 60% of routine tasks automated by 2027–28.
- Course Duration: 3–6 months for certifications; 6 months for OneLeap‘s intensive program.
Table of Contents
- What is Data Analytics?
- Evolution of Data Analytics in India
- Why Data Analytics Matters in 2026
- How to Become a Data Analyst
- Core Components of a Data Analytics Program
- Essential Data Analytics Tools
- Real-World Examples
- Course Comparison
- Best Practices to Get Hired Faster
- Common Mistakes to Avoid
- FAQs
- Final Summary
What is Data Analytics?
Data Analytics is the method of collecting, analyzing and interpreting raw and large datasets to dig out patterns, trends and correlations that help improve business decisions. It basically transforms raw facts and figures into actual and actionable insights that drive decision making across industries.
Types of Data Analytics
| Type | Question Answered | Example |
|---|---|---|
| Descriptive Analytics | What happened? | Monthly sales report, dashboard metrics |
| Diagnostic Analytics | Why did it happen? | Root cause analysis of customer churn |
| Predictive Analytics | What will happen? | Forecasting future sales using ML models |
| Prescriptive Analytics | What should we do? | Optimization recommendations for inventory |
Evolution of Data Analytics in India
The Past (2013–2023): Foundation and Big Data Revolution
The decade of 2013–2023 clearly defined the transformation of data analytics from a niche field to a business must-have in India.
2013–2015: The Big Data Emergence
- 2013: Big Data became important as organisations recognised fast data growth; companies began investing heavily in analytics.
- 2013–2014: IoT (Internet of Things) multiplied data streams from sensors, smartphones and smart devices.
- 2014: Digital India Initiative launched, creating the world’s largest biometrics database via Aadhaar enrolment.
2016–2018: Cloud and Enterprise Adoption
- 2016: UPI launch generated billions of transaction data points monthly; banking sector adopted analytics for fraud detection.
- 2017: Cloud computing (AWS, Azure, GCP) adoption grew 50% annually among Indian organisations.
- 2018: E-commerce platforms (Amazon, Flipkart) generated 50,000+ data analyst jobs.
2019–2021: Pandemic Acceleration
- 2020: COVID-19 pushed digital transformation — supply chain optimisation, remote work analytics, vaccine distribution planning.
- 2021: Startup India initiative enrolled 100,000+ startups; data became the core of every business.
2022–2023: Integration of AI
- 2022: Generative AI entered the market; predictive analytics adoption reached 40%.
- 2023: DPDP Act passed — data governance professionals required; 50,000+ new analyst jobs created.
- 2023: AI-powered automation replaced 20% of everyday analytics tasks; decision making became 5× faster.

Salary Range & Industry Value (2013–2023)
| Year | Fresher Salary | Industry Value |
|---|---|---|
| 2013 | ₹2–4 LPA | US$ 15 billion |
| 2018 | ₹3–5 LPA | US$ 45 billion |
| 2023 | ₹4–6 LPA | US$ 85 billion |
The Present Era (2026–27): AI-Powered Analytics Explosion
The present era represents the boost of AI-powered analytics in India, with extraordinary growth in demand, salary and industry value. India’s data analytics market is set to reach $118.7 billion by 2026, growing at a steady 15–18% CAGR.

11 Lakh Data Professionals Shortage (2026)
India faces a massive talent gap. The breakdown by skill shortage:
| Skill | Shortage | Importance |
|---|---|---|
| SQL Experts | 4 lakh | Critical for most analyst roles |
| Python Developers | 3.5 lakh | Core for automation & ML |
| Power BI Specialists | 2 lakh | Essential for visualisation in MNCs |
| ML/AI Engineers | 1.5 lakh | Fastest-growing requirement |
| Data Engineers | 1.2 lakh | Infrastructure backbone |
Job Distribution by Experience Level (2026–27)
| Experience | No. of Jobs | Avg. Salary | Skills Required |
|---|---|---|---|
| Fresher (0–1 yr) | 2,00,000 | ₹3.5–6 LPA | SQL, Excel, Basic Python |
| Junior (1–3 yrs) | 1,50,000 | ₹5–8 LPA | SQL, Python, Power BI |
| Mid-Level (3–5 yrs) | 1,00,000 | ₹8–14 LPA | Python, ML basics, Tableau |
| Senior (5–8 yrs) | 40,000 | ₹14–22 LPA | Advanced ML, Cloud, Leadership |
| Lead/Manager (8+ yrs) | 10,000 | ₹22–35 LPA | Strategy, AI governance, MLOps |

The Future Era (2027–2035): AI-Driven Transformation & Governance
The future era will transform data analytics from a manual and descriptive field into an AI-powered, automated, governed discipline. By 2030, predictive analytics adoption is projected at 85% and prescriptive at 70%.
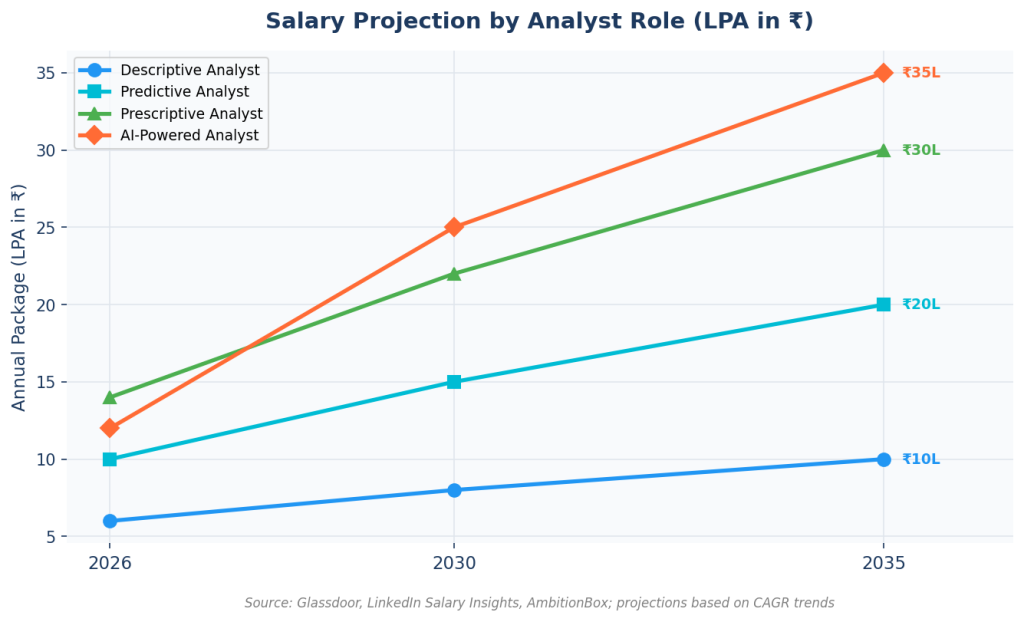
Salary Impact for Predictive/Prescriptive Experts
| Expertise Level | 2026 Salary | 2030 Salary (est.) | 2035 Salary (est.) |
|---|---|---|---|
| Descriptive Analyst | ₹6 LPA | ₹8 LPA | ₹10 LPA |
| Predictive Analyst | ₹10 LPA | ₹15 LPA | ₹20 LPA |
| Prescriptive Analyst | ₹14 LPA | ₹22 LPA | ₹30 LPA |
| AI-Powered Analyst | ₹12 LPA | ₹25 LPA | ₹35 LPA |

New Emerging Roles (2027–2035)
| Role | Responsibility | 2030 Salary (est.) |
|---|---|---|
| AI Analyst | Oversee AI automation, interpret AI outputs | ₹18–25 LPA |
| MLOps Engineer | Deploy and monitor ML models in production | ₹20–35 LPA |
| AI Governance Specialist | Ensure ethical AI, compliance, explainability | ₹25–45 LPA |
| Data Product Manager | Manage AI-driven data products | ₹25–40 LPA |
| Responsible AI Specialist | Audit AI for bias, fairness, transparency | ₹30–55 LPA |
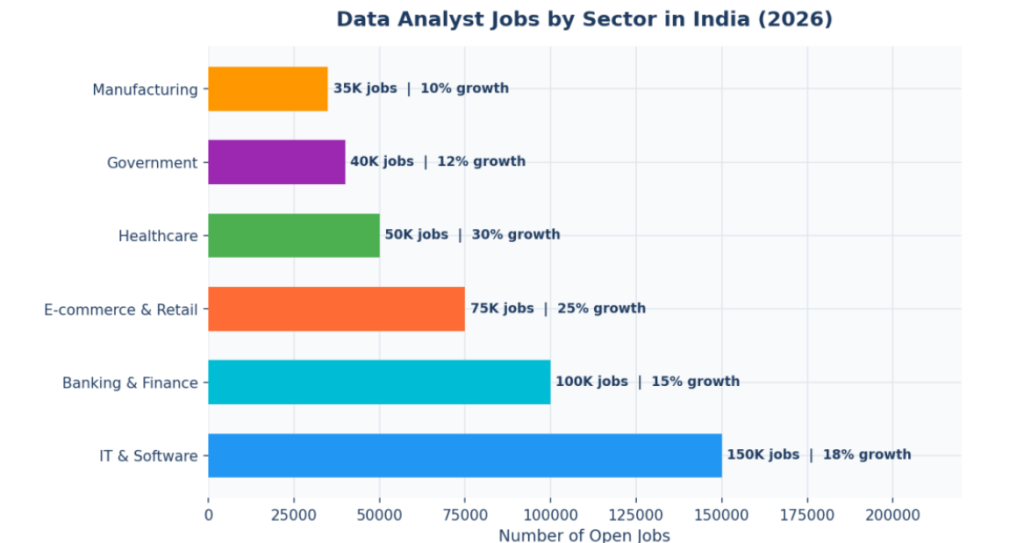
Why Data Analytics Matters in 2026
Data analytics is one of the most in-demand skills in 2026, with every sector utilising it for business decisions.
| Factor | Impact |
|---|---|
| Job Demand | India has a shortage of 11 lakh data professionals (NASSCOM 2025) |
| Industry Value | US$ 118.7 billion by 2026, growing to US$ 250–300 billion by 2035 |
| Salary Range | ₹3.5–6 LPA (fresher), ₹8–14 LPA (mid), ₹14–30+ LPA (senior) |
| AI Integration | AI-powered analytics growing 40% annually; 60%+ tasks automated by 2027–28 |
| Career Flexibility | Remote work, freelancing, full-time, consulting opportunities |
| Growth Rate | Salaries growing 12–15% annually in India |
How to Become a Data Analyst in India
Step 1: Collection of Data
Collect raw data from websites, apps, surveys and databases. This is the foundation of any analytics project.
Step 2: Cleaning of Data
Mend errors, manage absent values, remove duplicates and ensure data accuracy. Poor data quality leads to misleading insights.
Step 3: Analysis & Interpretation
Use Python, SQL and Excel to analyze data, find patterns and extract meaningful insights.
Step 4: Data Visualisation
Present findings through charts, graphs and dashboards using Power BI or Excel. Visual storytelling makes insights actionable.
Step 5: Decision Making
Deliver practical insights to stakeholders for smarter business choices. Convert technical findings into business recommendations.
OneLeap’s Strategic Data Analyst with AI program teaches this complete workflow with live sessions and real-world projects in just six months.
Core Components of a Data Analytics Program
A data analytics course should cover these core components:
- Programming Languages: Python for data manipulation, analysis and automation.
- Database Query: SQL for extracting and manipulating data from databases.
- Statistics & Probability: Understanding distributions, hypothesis testing and regression analysis.
- Data Visualisation: Creating charts, graphs and interactive dashboards using Power BI.
- Machine Learning Basics: Linear/logistic regression, classification and clustering for predictive analytics.
- Data Management: Organising, storing and cleaning data efficiently for analysis.
- Business Acumen: Understanding industry context, KPIs and translating insights into business value.
- AI/ML Governance: Ethical AI, responsible data use and explainability.
Essential Data Analytics Tools
| Category | Tools | Why It Matters |
|---|---|---|
| Programming | Python | Most in-demand skill; adds ₹1.5–2.5 LPA over SQL-only profiles |
| Database | SQL, MySQL | Non-negotiable — required in 90% of data analyst roles |
| Visualisation | Power BI, Tableau | Power BI drives +22% salary premium; standard for Indian MNCs |
| Spreadsheets | Excel (Advanced) | Foundation for beginner analytics |
| Machine Learning | Scikit-learn, Pandas | ML basics push profiles to ₹10+ LPA faster (+35%) |
| Big Data | Hadoop, Spark, AWS | Cloud rapidly becoming mandatory in product companies (+31%) |
| AI Integration | Generative AI, LLMs | Future-critical for 2027–35; 40% growth expected |
Real-World Data Analytics Examples
Example 1 : UPI Transaction Analytics (2016)
Problem: After UPI launched in 2016, NPCI faced 10 billion+ monthly transactions with no systematic fraud detection.
Solution: Built analytics infrastructure to track transaction patterns in real-time, identify suspicious clusters and detect duplicate ID fraud.
Tools Used: SQL, Python, Hadoop, Tableau
Results:
- 65% reduction in fraud losses (₹2,500 Cr saved annually)
- Transaction processing time reduced from 3 seconds to 200 milliseconds
- Enabled 10 billion monthly transactions by 2023
Impact: Made India the world’s largest real-time payment system, generating massive data for analytics growth.
Example 2 : BluEnt Gaming Fraud Detection (2026)
Problem: Gaming company faced 3–4 weeks manual reconciliation across 3 regions, delaying fraud detection and creating cash flow issues.
Solution: Automated Snowflake platform with real-time fraud detection, interactive dashboards and automated reconciliation.
Tools Used: Snowflake, Python, AWS
Results:
- 96% faster reconciliation — from 3–4 weeks to a few hours
- 3 regions unified under a single data model
- Fraud detection time reduced from weeks to minutes
Impact: Real-time analytics became mandatory for fraud detection, creating demand for Snowflake specialists.
Example 3 : Swiggy Real-Time Delivery Optimisation (2026)
Problem: Swiggy faced 25% delivery delays during peak hours, causing customer dissatisfaction and order cancellations.
Solution: AI-powered real-time route optimisation using GPS tracking of 50,000+ delivery partners and ML-based traffic analysis.
Tools Used: Python, Google Maps API, TensorFlow, Redis
Results:
- 40% reduction in delivery delays
- 20% increase in delivery capacity
- ₹300 Cr saved annually in operational costs
- Customer retention increased by 22%
Impact: Real-time analytics became standard in logistics, creating 25,000+ real-time analyst jobs.
Data Analytics Courses in India 2026: Comparison
| Course | Duration | Salary Range | Best For | Future-Ready Skills |
|---|---|---|---|---|
| OneLeap Strategic Data Analyst with AI (Dehradun) | 6 months | ₹5–12 LPA | Local students, zero-code option | AI/ML + Ethics |
| Google Data Analytics Certificate | 3–6 months | ₹4–10 LPA | Beginners, self-learners | Basic only |
| Scaler Data Analytics Program | 3–9 months | ₹8–18 LPA | Career switchers, premium track | ML + Cloud |
| Coursera IBM Data Analytics | 3–6 months | ₹4–10 LPA | Self-paced learners | Basic only |
| upGrad Data Analytics PG | 6–11 months | ₹8–18 LPA | Working professionals | AI + ML |
Best Practices for Learning Data Analytics
- Start with SQL and Excel: Foundation for all data roles. SQL is non-negotiable for 90% of jobs.
- Learn Python deeply: One programming language mastered well. Python adds ₹1.5–2.5 LPA over SQL-only profiles.
- Master Power BI: Standard for Indian MNCs; Power BI skill drives a 22% salary premium.
- Build 3+ Portfolio Projects: Use real datasets (Kaggle, government data). Candidates with 2–3 projects get 20–30% higher offers.
- Get Certified: Google Data Analytics, Microsoft Power BI PL-300 or OneLeap certification validates skills.
- Update LinkedIn Profile: Add projects, skills, certification badges. Recruiters actively search for data analysts on LinkedIn.
- Apply Early: Start job hunting 1 month before course completion on LinkedIn, Naukri, Internshala.
- Join Data Communities: Reddit, LinkedIn groups, local meetups for networking and job referrals.
- Job Switch at 18 Months: Internal hikes average 8–12%/year. Switching companies achieves 40–60% salary growth.
- Prepare for Future Skills: Learn AI governance, explainable AI and ethical data use to stay relevant through 2030+.
Common Mistakes to Avoid
| Mistake | Consequence | Solution |
|---|---|---|
| Learning too many tools at once | Confusion, no mastery, slow progress | Master SQL + Python first, then add Power BI |
| No portfolio projects | Can’t get hired despite certification | Build 3+ real-world projects with GitHub portfolio |
| Ignoring SQL completely | Limited jobs; 90% of roles require SQL | SQL is mandatory — spend 40% of learning time on it |
| Only theory, no practice | Can’t pass technical interviews | Hands-on projects with real datasets |
| Not networking on LinkedIn | Miss job referrals and opportunities | Join LinkedIn groups, attend meetups |
| Choosing online-only without support | High dropout rate, no guidance when stuck | Consider OneLeap for Dehradun-based mentorship |
| Ignoring future trends | Skills obsolete by 2027–28 | Learn AI governance, ethical AI, explainability |
| Paying for multiple courses | Wasted money, no completion | Complete one course fully before starting another |
Frequently Asked Questions
Q1. What is Data Analytics?
Data Analytics is the method of collecting, analyzing and interpreting large datasets to find patterns and connections that improve business decisions.
Q2. How to become a Data Analyst in India?
Learn SQL, Python, Excel and Power BI → Complete a certification or degree (OneLeap’s 6-month program recommended) → Build 3+ portfolio projects → Update LinkedIn and apply.
Q3. How much does a Data Analyst earn in India in 2026?
Freshers: ₹3.5–6 LPA | Junior: ₹5–8 LPA | Mid-Level: ₹8–14 LPA | Senior: ₹14–22 LPA | Lead/Manager: ₹22–35 LPA. National average: ₹6.87 LPA.
Q4. Is data analytics difficult to learn?
Not if you start with basics. SQL and Excel are easy to learn. Python takes 3–6 months with consistent practice. OneLeap’s zero-code AI option makes it easy for complete beginners.
Q5. Can I become a data analyst without a CS degree?
Yes. Anyone with a 12th-grade degree can apply. B.Com/BBA graduates with strong Excel and SQL skills can target ₹3.5–5 LPA; BTech freshers target ₹4.5–6 LPA.
Q6. Which certification course is best for data analytics in India 2026?
Top choices: OneLeap Strategic Data Analyst with AI (Dehradun — local training), Google Data Analytics Certificate, Microsoft Power BI PL-300, IIM Bangalore Program.
Q7. How much time is needed to pursue a career in Data Analytics?
Certification courses: 3–6 months | Instructor-led programs: 3–9 months (OneLeap: 6 months) | B.Tech: 4 years | M.Tech: 2 years.
Q8. Is OneLeap Dehradun good for data analytics training?
Yes. OneLeap offers an AI-powered Data Analytics Program with industry expert training, live sessions, zero-code options, practical projects and placement assistance for Dehradun/Uttarakhand students.
Final Summary
Data analytics is the process of studying raw data to uncover patterns and insights for better decision making. From its past evolution — when Big Data emerged and ML became conventional — to the present boom with India’s industry worth $118.7 billion and an 11-lakh professionals shortage, to the future transformation of AI-powered automation, predictive/prescriptive analytics, NLP integration and mandatory AI governance, data analytics has evolved into a business necessity.
Top Career Facts 2026–27
| Metric | Details |
|---|---|
| Fresher Salary | ₹3.5–6 LPA |
| Mid-Level Salary | ₹8–14 LPA |
| Senior Salary | ₹14–30+ LPA |
| National Average | ₹6.87 LPA |
| Course Duration | 3–6 months (certifications); 6 months (OneLeap) |
| Industry Value 2026 | US$ 118.7 billion |
| Jobs Available | 500,000+ open positions |
| Future Outlook | 40% growth in AI analytics roles; 60% task automation by 2027–28 |
Ready to Start Your Data Analytics Career?
Join OneLeap Dehradun’s Strategic Data Analyst with AI — hands-on training,
industry-expert mentorship, future-ready AI skills and placement assistance.
Stay updated with the latest AI, Data Science, and Automation insights by following OneLeap on LinkedIn and Instagram.
Leave a Reply